This on-line Fingerprint Library allows you to explore and understand the principal petrographic differences among world coking coals. Each coal is unique – and so is its’ Fingerprint.
For over a decade, we have recorded Fingerprints – Reflectance Profiles – of coals from all over the world, but because most of them are not our property and are protected by client-confidentiality, we cannot use them. Instead we have prepared a collection of modeled coals that are virtually identical to the coal Fingerprints of the naturally-occurring coking coals.
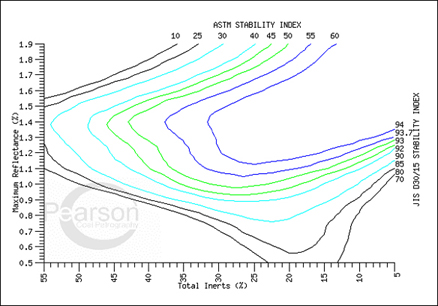
To illustrate Fingerprint variation, and how this impacts quality of metallurgical cokes, we have chosen the ASTM coke-strength Stability Index, or Coke Strength prediction, as the base graph (Figure 1). Other parameters could equally have been used – for example the prediction of Plastic Layer Thickness, measured in the Sapozhnikov test, and featured in Chinese & Russian coal classifications! The graph is shown below in terms of coal Rank and coal Type. Move the mouse over the graph, and a corresponding mathematically-modelled coal Fingerprint for that particular Maximum Vitrinite Reflectance & Total Inert content is displayed, in the transposed terms – Random reflectance & Vitrinite percent – the parameters of the ISO Coal Classification. The unique five digit identifier code is derived from the percent Vitrinite, and Random reflectance (x100), for the coal shown in the profile.
These diagrams illustrate that Provincialism plays a big part in dictating the quality of a coal (Fig. 2, below). For example, coal 50123, from Australia, and 67142, from Canada, both have the same Volatile Matter content of about 23% DAF, yet their Romax and Vitrinite content are quite different. Because VM is not an independent variable, alone, it is a relatively insensitive measure of Rank , so care must be taken when comparing coals, especially from different parts of the world, as in the ASTM Classification of Coal by Rank.
The Library is best viewed at 1024×768 resolution, but if you are running a greater resolution, you may wish to resize your browser so that the Fingerprint graph does not overlay the Coke Strength graph